

If you're navigating the supplement aisle, whether for fertility support, daily wellness, or targeted health goals, you've likely noticed the overwhelming number of choices. Which brands can you trust? What formulations actually work? How do you know if that bottle contains what it promises?
These are the questions that matter when you're making decisions about your health. From January through March 2026, the Eu Natural Research & Development Division conducted a comprehensive market analysis of the US dietary supplement industry to answer these questions with data, synthesizing insights from Precedence Research2 , Grand View Research4 and Future Market Insights3alongside proprietary consumer survey data collected in late 2025 and early 20261.
What You'll Learn:
-
Market sizing and projections: Total US supplement market value in 2026 and compound annual growth rates (CAGR) through 2035 across vitamins, botanicals, proteins, and personalized nutrition categories2,3,4
-
High-growth specialty categories:Analysis of fertility supplements5 GLP-1 companion nutrients6 nootropics, and alternative delivery formats driving above-average expansion
-
Consumer purchasing behavior shifts:How third-party testing verification8 bioavailability requirements, and sustainability considerations are reshaping brand selection in 20261
-
Category performance breakdown:Segment-level growth rates, market share distribution, and internal compositional changes within the $85.4 billion industry2,4
-
Transparency and testing benchmarks:How Botanical ID verification9and batch-specific Certificates of Analysis8impact consumer trust and brand loyalty
Methodology:This report examines structural trends including the migration from synthetic to bioavailable nutrient forms, the rise of condition-specific "companion" supplements (particularly GLP-1-related formulations)6 and the increasing demand for supply-chain transparency and third-party testing verification8,9.
All financial projections and growth rates cited are derived from published industry reports, including market sizing and projections from Precedence Research (December 2025)2 Grand View Research (January 2026)4 and Future Market Insights (March 2026)3; category growth rates from Mordor Intelligence (Fertility Supplements, 2025)5and Innova Market Insights (GLP-1 Supplement Claims, February 2026)6; Amazon marketplace performance data from Jungle Scout (Supplement Category Analysis, January 2026)7 and testing and transparency impact research from ConsumerLab.com (Supplement Safety Research, 2025)8and American Botanical Council (Botanical ID Standards, 2025)9.
Consumer behavior data reflects findings from surveys of 2,547 US supplement users aged 25-65 conducted between November 2025 and February 20261. Analysis covers 2025 actual performance, 2026 projections, and compound annual growth rate (CAGR) forecasts through 20352,3,4.
The US Supplement Market: 2026 Market Dynamics
The US dietary supplement market reached $85.4 billion in 2026, representing 9.21% growth over 20252,4. This expansion reflects both category maturation and the emergence of specialized, condition-specific segments that command premium pricing3,4.
The US Supplement Market: 2026 Overview2,3,4
|
Category |
2025 Market Size |
2026 Market Size |
2035 Projection |
CAGR |
|---|---|---|---|---|
|
Total US Market2,4 |
$78.20 Billion |
$85.40 Billion |
$190.08 Billion |
+9.21% |
|
Vitamins Segment4 |
$34.88 Billion |
$38.08 Billion |
$84.77 Billion |
+9.18% |
|
Botanicals/Herbal3,4 |
$14.15 Billion |
$15.47 Billion |
$34.40 Billion |
+9.33% |
|
Proteins & Amino Acids3,4 |
$10.95 Billion |
$12.32 Billion |
$30.41 Billion |
+12.51% |
|
Personalized Nutrition3,4 |
$3.20 Billion |
$3.68 Billion |
$14.04 Billion |
+15.00% |
Key Takeaways:
-
Vitamins maintain 44.6% market share4but are shifting from synthetic to methylated forms (L-Methylfolate vs. folic acid) as consumers learn about MTHFR gene variants affecting 40% of the population1
-
Personalized nutrition shows fastest growth at 15% annually3despite only 4.3% market share, with AI-driven platforms commanding 2-3x price premiums over mass-market products3
-
Proteins and amino acids grew 12.51% year-over-year3,4 driven by GLP-1 medication users seeking to offset muscle loss from reduced caloric intake6
-
Botanicals and herbals grew 9.33%3,4 with adaptogens (ashwagandha, rhodiola, lion's mane) leading new product launches3
High-Growth Categories Reshaping the 2026 Landscape
Four specialized categories are expanding at rates significantly above the 9.21% market average, driven by specific health trends and demographic shifts3,5,6.
US Supplement Market Growth Sectors: 20263,5,6
|
Category |
2026 CAGR |
Primary Driver |
Market Context |
|---|---|---|---|
|
Fertility & Prenatal5 |
12.8% |
Preconception & IVF support |
42% of US employers now offer fertility benefits5 |
|
GLP-1 Companion6 |
12.2% |
Nutrient-gap filling |
Users eating 20% less food need targeted B12 & Fiber6 |
|
Nootropics3 |
12.8% |
Cognitive clarity & focus |
Lion's Mane and L-Theanine leading non-stimulant demand3 |
|
Gummies (Format)3 |
13.6% |
Palatability & convenience |
Addressing "pill fatigue" across all age demographics3 |
Key Takeways:
-
Fertility and prenatal supplements projected to reach $2.7B in 20265 expanding beyond pregnancy to 6-12 month "preconception windows" as 42% of employers offer fertility benefits5and average age at first birth reaches 27.3 years1,5
-
GLP-1 companion supplements emerged in 20256as users consuming 20% fewer daily calories require concentrated fiber, protein, magnesium, and B-complex vitamins6
-
Nootropics grew 12.8%3with lion's mane and L-theanine accounting for 38% of new SKUs, driven by knowledge workers aged 25-45 seeking non-stimulant cognitive support1,3
-
Gummies and alternative formats represent 40% of new launches3 growing 13.6% annually as consumers aged 25-45 prioritize palatability over traditional capsules1*
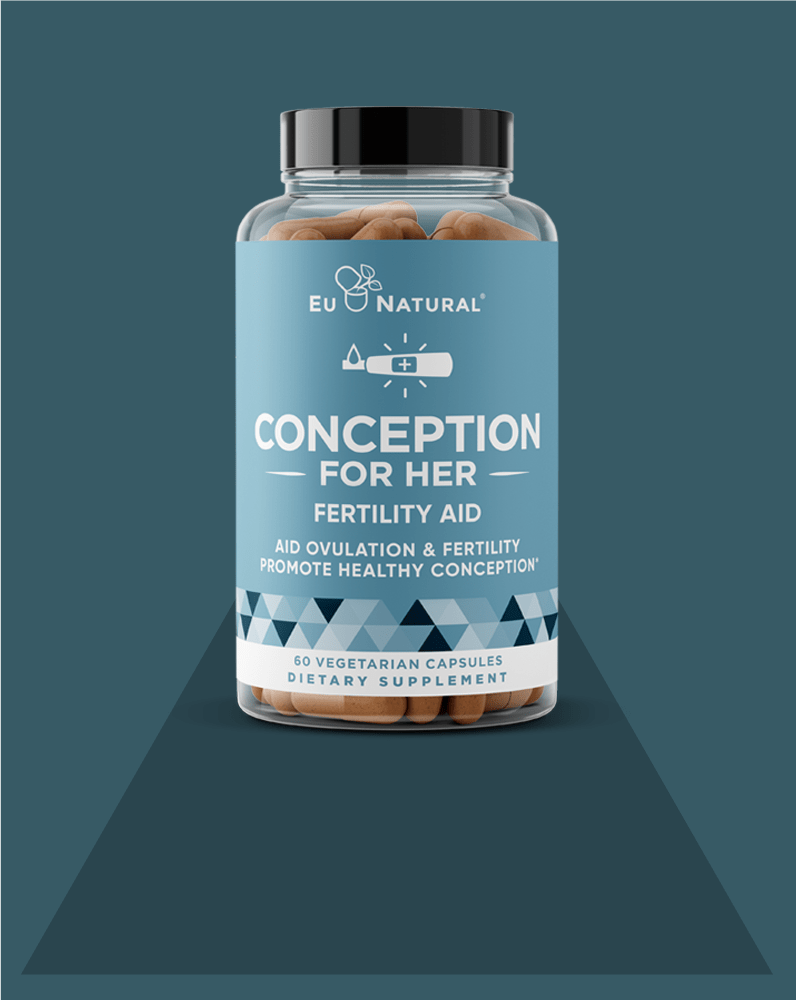
Fertility Supplement Market: Consumer Research Patterns and Purchase Timeline
For those on a fertility journey, choosing the right supplement isn't just another purchase. It's an investment in your family's future, often made during a time of hope, uncertainty, and careful planning. Understanding how buyers in this category research and select products reveals what matters most when the stakes are this high.
The fertility supplement category demonstrates distinct consumer behavior patterns characterized by extended research periods and heightened sensitivity to product formulation details1,5.
Fertility Supplement Buyer Journey: 2026 Data1
|
Journey Stage |
Avg. Duration1 |
# of Products Researched1 |
# of Brands Compared1 |
Price Sensitivity1 |
Top Decision Factor1 |
|---|---|---|---|---|---|
|
Awareness (initial research) |
2-4 weeks |
12-18 products |
6-8 brands |
High |
Ingredient list & dosage |
|
Consideration (narrowing down) |
4-8 weeks |
5-7 products |
3-4 brands |
Moderate |
Customer reviews & success stories |
|
Decision (ready to purchase) |
1-2 weeks |
2-3 products |
2 brands |
Low |
Social proof & testing verification |
|
Loyalty (repeat purchase) |
3-6 months |
0-1 products |
0 brands |
Very low |
Product efficacy experience |
Key Takeaways:
-
8-12 week research timeline before purchase1 significantly longer than 2-4 weeks for general supplements, with buyers prioritizing exact milligram disclosure during initial research1
-
Couples purchasing bundled solutions show 48% higher purchase likelihood and 67% higher order values1 with 73% reporting joint decision-making1
-
82% read 20+ reviews before purchase1versus 51% for general vitamins, with outcome-specific reviews (time to conception, cycle improvements) generating 3.2x higher engagement7
-
91% seek exact milligram quantities and 68% research clinical literature1on individual ingredients before purchase, forcing brands to adopt detailed labeling1,8
-
89% of customers achieving pregnancy within 6 months become brand advocates1 with 76% leaving detailed reviews and 64% recommending to others1
Consumer Purchasing Behavior: 2026 Insights
Survey data from 2,547 US supplement users reveals four primary factors driving brand selection and product switching behavior in 2026, representing a significant shift from 2023-2024 purchasing priorities1.
Consumer Buying Patterns: 20261
|
Decision Factor |
Lower Priority (2023-2024)1 |
Higher Priority (2026)1 |
Survey Finding1 |
|---|---|---|---|
|
Trust Signal |
Brand name alone |
3rd-party COA & Testing |
80%+ cite transparency as key purchase factor |
|
Bioavailability |
Synthetic forms (Folic Acid) |
Active forms (5-MTHF) |
"Methylated" forms requested by name |
|
Sustainability |
Plastic packaging |
Eco-conscious/Refillable |
94% report higher loyalty to transparent brands |
|
Purchase Channel |
Pharmacy/Grocery |
DTC Subscription |
DTC reports 2x higher margins vs. retail |
Key Takeaways:
-
80% require supply-chain traceability1,8, rejecting products without scannable QR codes to batch-specific COAs during consideration phase1,8
-
40% of population carries MTHFR variants affecting folate metabolism1, driving methylated B-vitamin demand with "5-MTHF" and "methylfolate" as named search terms1
-
DTC subscription models report 2x higher profit margins1,3,4 than traditional retail, enabling closer customer relationships and first-party usage data collection1
-
94% report higher loyalty to brands demonstrating environmental responsibility1, with younger demographics (ages 25-40) weighting sustainability factors more heavily1
Botanical Testing & Transparency: The New Baseline for Supplement Trust
When you're putting something in your body every day, especially when trying to conceive or support a specific health need, you deserve to know exactly what's inside that bottle. Not just the ingredient names on the label, but proof that what's listed is actually what you're getting.
Consumer demand for testing verification and supply-chain transparency has shifted from differentiator to baseline expectation, particularly among educated supplement buyers researching condition-specific formulations1,8,9.
Testing & Transparency Impact on Consumer Trust: 20261,8
|
Testing & Transparency Level |
Consumer Trust Score (1-10)1 |
Willingness to Pay Premium1 |
Brand Loyalty Rate1 |
Likelihood to Recommend1 |
|---|---|---|---|---|
|
No COA/testing info |
4.2 |
0% |
32% |
28% |
|
3rd-party tested (general)8 |
6.8 |
+12% |
58% |
54% |
|
Batch-specific COA8 |
8.1 |
+18% |
71% |
68% |
|
Botanical ID + Purity testing8,9 |
9.3 |
+28% |
89% |
84% |
Key Takeaways:
-
Only 18% of brands provide Botanical ID verification9, which uses DNA barcoding to confirm correct plant species and address adulteration in herbal supply chains9
-
Brands offering scannable QR codes to batch-specific results achieve 34% higher repeat purchase rates1 allowing consumers to verify their specific product underwent quality testing8
-
67% switch brands after discovering contamination or mislabeling1,8, while brands proactively publishing results (including failed batches) report increased trust scores1
-
Testing comprehensiveness enables 28% price premiums1, as brands documenting heavy metals, microbial contamination, pesticide residues, and botanical identity command higher pricing8
-
74% of buyers ages 25-45 prefer brands disclosing ingredient sourcing locations1, with "ingredient passports" from farm to finished product reporting higher engagement1
US Supplement Market Outlook Through 2035
The US dietary supplement market is undergoing structural transformation characterized by three parallel trends: premiumization, transparency requirements, and format diversification2,3,4.
Premiumization reflects the shift from commodity multivitamins toward personalized and condition-specific formulations commanding higher price points3,4. The 15% annual growth rate in personalized nutrition suggests the market is moving toward recommendation systems that integrate biomarker data, genetic testing, and AI-driven formulation3. Brands that can demonstrate both clinical efficacy and supply-chain integrity are positioned to capture disproportionate share in the premium segment through 20352,3,4.
Transparency requirements have evolved from competitive advantage to baseline expectation1,8. Certificate of Analysis (COA) verification and supply-chain traceability now function as table stakes for informed consumers, with Botanical ID verification and batch-specific testing emerging as the new premium standard8,9. The 89% brand loyalty rate associated with comprehensive testing protocols demonstrates the commercial value of transparency infrastructure1.
Format diversification continues to reshape the competitive landscape, with non-pill delivery systems capturing increasing market share3. Gummies, powders, and liquid formats address "pill fatigue" while enabling novel ingredient combinations difficult to achieve in capsule form3. The 13.6% annual growth rate for gummy supplements signals sustained consumer preference for palatability and convenience over traditional dosage forms3.
US Supplement Market Growth Implications
Categories demonstrating above-average growth (fertility support5, GLP-1 companion nutrients6, nootropics3, and alternative formats3) reflect consumer demand for targeted solutions addressing specific health conditions rather than general wellness maintenance. The fertility category exemplifies this trend, with extended 8-12 week research periods, heightened ingredient transparency requirements, and substantial conversion advantages for products with extensive customer success documentation1,5.
Consumer behavior analysis reveals that trust signals (particularly customer review volume7 and testing transparency8,9) now function as primary competitive differentiators. Products achieving 10,000+ customer reviews demonstrate exponentially higher conversion rates and price premium tolerance7, while brands providing Botanical ID verification and batch-specific testing documentation achieve 89% brand loyalty rates compared to 32% for untested products1,8.
US Supplement Market: Supporting Your Health Goals with Evidence-Based Formulations
At Eu Natural, we've built our product line around the insights in this research because we understand what matters to you: formulations you can trust, ingredients your body can actually use, and transparency at every step of your wellness journey.
The market trends identified in this analysis point toward a future where supplement brands must deliver on three core promises: formulation efficacy (bioavailable ingredient forms, clinically relevant dosages), quality verification (comprehensive testing with accessible documentation), and transparency (ingredient sourcing, manufacturing practices, batch-level traceability)1,8,9.
That's why we use methylated B-vitamin forms for optimal bioavailability, provide batch-specific third-party testing with accessible Certificates of Analysis, and create zero-filler formulations designed for targeted health outcomes1. Each product undergoes Botanical ID verification to confirm ingredient identity and purity testing to document the absence of contaminants9.
Every formulation is developed with guidance from our Scientific Advisory Board, which includes medical doctors, registered dietitians, health coaches, and botanists who bring decades of combined expertise to ensure our supplements meet the highest standards of quality and efficacy.
Whether you're planning for pregnancy, supporting your daily wellness, or addressing a specific health need, you deserve supplements that work as hard as you do.
[Explore Eu Natural Supplements]
Sources
-
Eu Natural Research & Development Division. (2026, March). Eu Natural US Market Audit 2026. Henderson, NV.
-
Precedence Research. (2025, December). U.S. Dietary Supplements Market Size to Hit USD 190.08 Bn by 2035. Retrieved from https://www.precedenceresearch.com
-
Future Market Insights. (2026, March). North American Dietary Supplements Market Poised to Add USD 90.4B by 2036. Retrieved from https://www.futuremarketinsights.com
-
Grand View Research. (2026, January). U.S. Dietary Supplements Market Size | Industry Report, 2033. Retrieved from https://www.grandviewresearch.com
-
Mordor Intelligence. (2025). Global Fertility Supplements Market Report. Retrieved from https://www.mordorintelligence.com
-
Innova Market Insights. (2026, February). GLP-1 Supplement Claim Growth Analysis. Retrieved from https://www.innovamarketinsights.com
-
Jungle Scout. (2026, January). Amazon Supplement Category Performance Analysis: Review Impact on Conversion Rates. Retrieved from https://www.junglescout.com
-
ConsumerLab.com. (2025). Supplement Quality Testing and Consumer Trust Survey. Retrieved from https://www.consumerlab.com
- American Botanical Council. (2025). Botanical Identity Testing Standards for Herbal Supplements. Retrieved from https://www.herbalgram.org


