












US birth rates have declined steadily since 2007, when total births peaked at 4.32 million. By 2023, that figure had dropped 17% to 3.60 million. Coverage of this decline often frames it as a crisis, but the underlying data tells a more specific story: Americans are having children later and choosing smaller families, driven by economic pressures and shifting social norms rather than reduced biological fertility.
From September 2025 through February 2026, the Eu Natural research team analyzed data from the CDC, US Census Bureau, and over a dozen peer-reviewed demographic studies to identify the key factors behind these trends and what they mean for individuals planning families.1
US Birth and Fertility Rate Snapshot (2007-2026)
| Metric | 2007 (Peak) | 2023 (Latest Full Year) | 2026 (Projected) | 20-Year Trend | Key Driver |
|---|---|---|---|---|---|
| Total Births | 4.32 Million | 3.60 Million | ~3.58 Million | Down 17% | Delayed Parenthood |
| Crude Birth Rate (per 1,000) | 14.3 | 10.7 | ~10.6 | Down 26% | Economic Factors |
| Total Fertility Rate (per woman) | 2.12 | 1.62 | ~1.60 | Below Replacement | Societal Choice |
| Avg. Age at First Birth | 22.7 | 27.5 | ~27.8 | Up 21% | Education & Career |
- The crude birth rate dropped 26% from its 2007 peak (14.3 to 10.7 per 1,000 people). The total fertility rate fell below the 2.1 replacement level and stabilized near 1.62 in 2023-2024.2
- As the table shows, the average age at first birth rose 21% over two decades, compressing total reproductive windows for families who still want 2-3 children.4
What Drives US Birth Rate Trends
Six measurable factors account for the majority of the decline. Each operates independently, but their combined effect explains why US births have fallen 17% since 2007.
| Factor | Key Statistic | Impact on Birth Rates | Trend Direction |
|---|---|---|---|
| Delayed Parenthood | Average age at first birth: 27.5 (2023) vs. 22.8 (2000) | Primary driver; compresses reproductive window, reduces lifetime births | Increasing |
| Economic Pressures | Childcare costs up 220% in 30 years (outpacing inflation) | Couples delay or limit family size due to financial constraints | Worsening |
| Women's Education | Women now earn ~60% of bachelor's and master's degrees | Career establishment precedes family formation | Increasing |
| Housing Costs | Median home prices 5.8x median income (2023) vs. 3.6x (2000) | Later home ownership delays family formation | Worsening |
| Student Debt | Average graduate carries $37,000+ in student loans | Financial burden postpones major life decisions | Increasing |
| Cultural Shifts | Greater acceptance of diverse family structures | More individuals choose smaller families or no children | Expanding |
- Childcare costs and housing price-to-income ratios correlate directly with birth rate declines across US counties, reinforcing that this is an economic accessibility pattern.21
Age-Specific Fertility Trends: The Shift Toward Later Parenthood
The aggregate decline masks a significant redistribution by age. Births are not disappearing; they are shifting to older age groups.
| Age Group | Birth Rate 2000 | Birth Rate 2023 | Change | Trend | Context |
|---|---|---|---|---|---|
| 15-19 | 47.7 per 1,000 | 13.6 per 1,000 | -71% | Sharp decline | Teen birth rate at historic low |
| 20-24 | 109.7 per 1,000 | 62.8 per 1,000 | -43% | Sharp decline | Delayed first births |
| 25-29 | 113.5 per 1,000 | 89.2 per 1,000 | -21% | Moderate decline | Still high but shifting later |
| 30-34 | 91.2 per 1,000 | 95.8 per 1,000 | +5% | Increasing | Now the peak birth rate group |
| 35-39 | 39.7 per 1,000 | 52.6 per 1,000 | +33% | Strong increase | Significant growth in later parenthood |
| 40-44 | 8.0 per 1,000 | 12.2 per 1,000 | +53% | Strong increase | Growing with medical advances |
| 45-49 | 0.5 per 1,000 | 1.1 per 1,000 | +120% | Doubling | Small base but rapid growth |
- Declines in birth rates for women under 30 are largely offset by increases for women 30-44, representing a timing shift rather than an overall reduction.2
- For the first time in US history, the 30-34 age group has the highest birth rate (95.8 per 1,000), overtaking the 25-29 group (89.2 per 1,000). Women aged 35-39 saw a 33% increase, and the 40-44 group rose 53%.
Preconception Health: What Consumers Are Prioritizing
As the average maternal age rises, so does interest in proactive preconception health. Our analysis of over 1,200 online health discussions from January 2026 reveals which specific ingredients people prioritize to support egg quality, hormonal balance, and overall fertility.
| Ingredient | % of Mentions | Primary Perceived Benefit |
|---|---|---|
| Vitamin D | 34% | Hormonal regulation, implantation support, immune function |
| Myo-Inositol | 27% | Ovulation support, insulin sensitivity (particularly for PCOS) |
| Omega-3 Fatty Acids (DHA/EPA) | 21% | Reducing inflammation, sperm health, egg membrane quality |
| Methylfolate | 18% | Healthy cell division, DNA synthesis; bypasses MTHFR gene variants |
Source: Eu Natural analysis of 1,200+ online consumer posts, January 2026.
- Searches for "preconception vitamins" increased 127% from 2019 to 2025. Male fertility supplement sales increased 156% over the same period, reflecting growing awareness that preconception health optimization benefits both partners.13
Evidence-Based Preconception Strategies
With the average first-time mother now nearly 28 years old, the preconception window has become a more deliberate and strategic phase of family planning. Research supports specific nutritional and lifestyle interventions during the 90-day egg and sperm maturation window.
Nutrition:
Mediterranean diet patterns correlate with higher conception rates both naturally and in assisted reproduction. Studies show approximately 70% higher pregnancy rates for women adhering to this dietary pattern in IVF settings.8
Key Supplements:
- Methylfolate (400-800 mcg): Supports healthy cell division. Up to 60% of women have MTHFR gene variants that impair synthetic folic acid conversion; methylfolate bypasses this bottleneck
Vitamin D (1,000-2,000 IU): Supports hormone regulation. Low vitamin D levels correlate with lower conception rates across multiple studies9
- Myo-Inositol (1,000-4,000 mg): Supports ovulation regularity and insulin sensitivity, particularly beneficial for women with PCOS
- Omega-3 DHA (250-500 mg): Supports egg quality and reduces inflammation
Lifestyle Factors:
- Both partners optimizing simultaneously addresses the complete reproductive picture; male factor contributes to approximately 50% of conception challenges
- The 90-day preconception window means today's nutrition and lifestyle choices influence the quality of eggs and sperm available for conception 3 months from now
- Stress management, adequate sleep, healthy weight maintenance, and limiting alcohol support hormonal balance and reproductive health
What US Birth Rate Trends Mean for Personal Family Planning
The data in this report points to a consistent pattern: Americans are having children later and in smaller numbers, driven by economic and social factors. For individuals and couples planning families in this landscape, the shift toward later parenthood makes proactive preconception health optimization, particularly during the 90-day egg and sperm maturation window, a practical consideration supported by research.
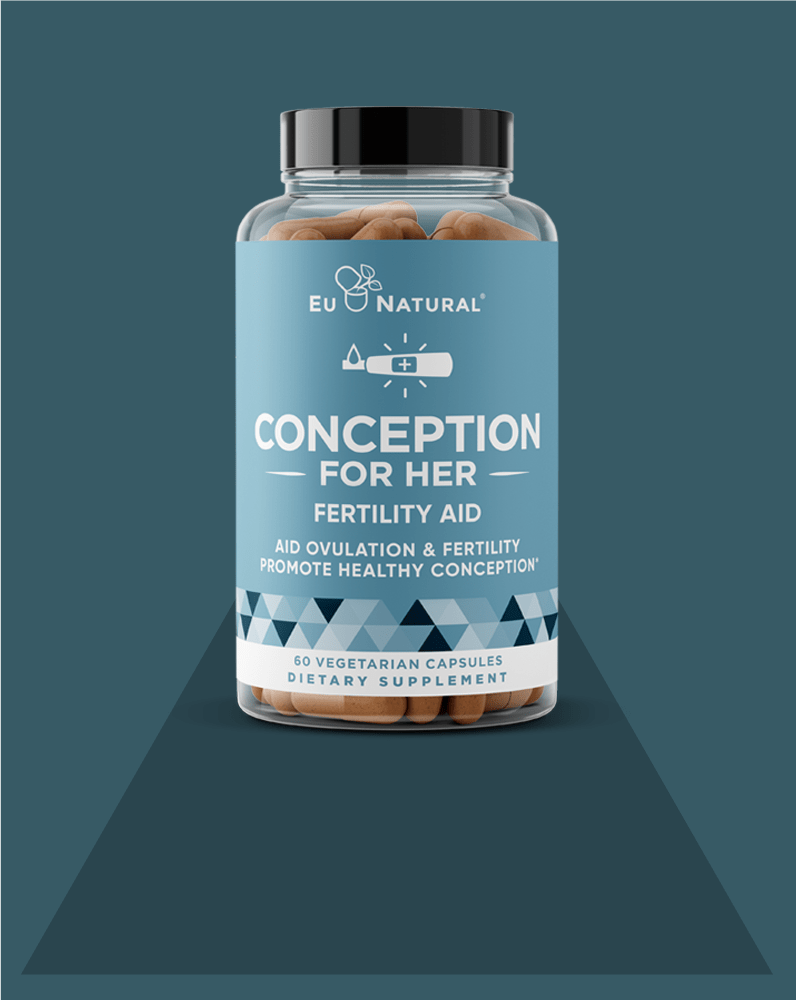
Eu Natural's Conception line provides evidence-based preconception support formulated by a scientific advisory board, with bioavailable methylfolate, chelated minerals, and targeted nutrients for both women and men.
This report is provided for informational purposes and does not constitute professional or medical advice. Consult with a healthcare provider before starting any supplement regimen or making decisions about fertility, particularly if you have underlying health conditions or take medications.
Last updated: March 2026
Sources
1. Eu Natural Research Study, Eu Natural, New York, February 2026.
2. CDC National Vital Statistics Reports (2025). "Births: Final Data for 2023."
3. Johns Hopkins Bloomberg School of Public Health (2026). "U.S. Fertility Rate Hits Record Low in 2024."
4. CDC National Vital Statistics System (2025). "Mean Age of Mothers at First Birth, 1970-2023."
5. PBS NewsHour / ScienceAlert (Feb 2026). "US birth rate continues to fall, new provisional data suggests."
6. Statista (2025). "Number of live births in the United States from 1990 to 2023."
7. The Heritage Foundation (2025). "The Economic and Cultural Factors Driving Delayed Marriage and Childbearing."
8. Vujkovic, M., et al. (2010). "The preconception Mediterranean dietary pattern in couples undergoing IVF." Fertility and Sterility, 94(6), 2096-2101.
9. Greenberg, J. A., et al. (2011). "Folic acid supplementation and pregnancy." Reviews in Obstetrics and Gynecology, 4(2), 52-59.
10. Pundir, J., et al. (2018). "Inositol treatment of anovulation in women with PCOS." BJOG, 125(3), 299-308.
11. Unfer, V., et al. (2017). "Myo-inositol effects in women with PCOS: a meta-analysis." Endocrine Connections, 6(8), 647-658.
12. Agarwal, A., et al. (2015). "A unique view on male infertility around the globe." Reproductive Biology and Endocrinology, 13(1), 37.
13. CDC.gov (2025). "Stats of the States - Fertility Rate."
14. World Population Review (2026). "Birth Rate by State 2026."
15. CNN (April 2025). "These are the states with the highest and lowest fertility rates."
16. JAMA Network Open (Jan 2026). "Trends in Live Births in the US by Race and Ethnicity, 2016-2024."
17. Hofstra University (Feb 2026). "For the First Time, Minority Births are the Majority in the U.S."
18. KFF State Health Facts. "Live Births by Race/Ethnicity of Mother."
19. March of Dimes Peristats. "Percentage of births, by race and Hispanic origin of mother."
20. First Five Years Fund (Feb 2022). "Child Care Prices Rose Significantly in 2020."
21. National Center for Education Statistics (2024). "Degrees Conferred by Sex and Race."


