












Headlines about declining birth rates can feel alarming for anyone planning a family. But population-level statistics measure collective societal behavior, not individual biological capacity. The total fertility rate (TFR) reflects when people choose to have children, how many they have, and whether economic conditions support family formation. It does not predict your ability to conceive.
From August 2025 through January 2026, our research team compiled data from CDC vital statistics reports, United Nations population databases, and peer-reviewed reproductive health studies to analyze US and global fertility rate trends alongside the controllable factors that influence personal conception success.1
US Total Fertility Rate: 2016-2026
| Year | US Total Fertility Rate (TFR) | % Change from Previous Year | Key Trend/Milestone |
|---|---|---|---|
| 2016 | 1.82 | -1.1% | Continued post-recession decline |
| 2018 | 1.73 | -1.7% | Decline accelerates slightly |
| 2020 | 1.64 | -4.1% | COVID-19 pandemic impact |
| 2022 | 1.67 | +0.6% | Slight post-pandemic rebound |
| 2023 | 1.62 | -3.0% | Lowest rate recorded |
| 2024 | 1.62 | 0.0% | Stabilization at new baseline |
| 2026 (Proj.) | ~1.61 | -0.6% | Trend of stability expected to continue |
Key Findings:
- After dropping to 1.62 in 2023 (the lowest recorded rate), the TFR stabilized in 2024. Projections show continued stability through 2026. This reflects predictable responses to economic pressures, pandemic disruption, and generational shifts in family planning priorities.
- The pandemic dip in 2020 (-4.1%) and modest rebound in 2022 (+0.6%) demonstrate that TFR responds to external conditions like economic uncertainty and social disruption, not declining reproductive capacity.2
- The US rate remains significantly higher than many developed nations: South Korea (0.72), Spain (1.16), Italy (1.24), showing comparatively resilient family-building patterns.1
What Total Fertility Rate Actually Measures
The Total Fertility Rate is a demographic snapshot. It represents the average number of children a woman would have in her lifetime if she experienced the exact current age-specific fertility rates throughout her reproductive years.1 In simpler terms, TFR reflects current population behavior, not individual biological capacity.
The "replacement level" of 2.1 is the rate needed for a population to replace itself from one generation to the next without immigration.3 While the US TFR sits at a historic low of 1.6, this largely reflects societal choices like delaying parenthood and having smaller families. About 84% of US women aged 40-44 have had a child, showing that personal fertility outcomes often differ substantially from population-level statistics.4
Global TFR Comparison: 2024
| Region | TFR (2024) | Above/Below Replacement | 10-Year Change | Primary Drivers |
|---|---|---|---|---|
| Global Average | 2.3 | Above (2.1) | Down from 2.8 | Economic development, education access |
| United States | 1.6 | Below (2.1) | Down from 2.1 | Delayed childbearing, economic pressures |
| Europe | 1.5 | Below (2.1) | Down from 1.6 | Economic uncertainty, social shifts |
| Africa | 4.1 | Well Above (2.1) | Down from 5.1 | Improving education, healthcare access |
| East Asia | 1.1 | Far Below (2.1) | Down from 1.6 | Economic pressures, cultural factors |
Key Insights:
- The global average of 2.3 remains above replacement level because high-fertility regions like Africa (4.1) offset low-fertility developed nations. As economic development spreads and education access improves globally, fertility rates naturally decline. This reflects empowered family planning choices and economic realities, not biological decline.1
- Developed nations cluster below replacement level (US: 1.6, Europe: 1.5, East Asia: 1.1), driven by similar factors: higher cost of living, delayed parenthood for education and career establishment, and greater acceptance of diverse family structures.
What Drives Fertility Rate Changes
The decline in TFR is primarily a story about modern life, not biology. Understanding both the population-level trends and the individually controllable factors provides a complete picture.
External Factors: Population-Level Trends
These factors explain why TFR has declined but do not determine your individual reproductive capacity:
| Factor | Description | Impact on TFR |
|---|---|---|
| Economic Pressures | Average cost to raise one child to age 18: $320,000 (16% of family income annually) | Couples delay or limit family size due to economic uncertainty |
| Delayed Parenthood | Average age of first-time mothers rose from 21 (1970) to 27.5 (2024) | Later starts naturally limit total number of children per woman |
| Social & Cultural Shifts | Women now earn nearly 60% of all bachelor's and master's degrees in the US | More individuals choose smaller families or no children |
| Environmental Factors | Over 1,000 chemicals identified as potential endocrine disruptors by the Endocrine Society | May impact fertility at population level; individual exposure varies widely |
Controllable Factors: Individual Optimization
These factors directly influence egg and sperm quality regardless of TFR trends:
| Factor | Description | How It Supports Fertility |
|---|---|---|
| 90-Day Preconception Window | Eggs take ~90 days to mature before ovulation; sperm production cycle is 86-95 days | Today's choices influence the quality of the egg and sperm used for conception in 3 months |
| Evidence-Based Nutrition | Mediterranean diet patterns linked to higher conception rates | ~70% higher chance of pregnancy for women adhering to this diet (in IVF settings) |
| Targeted Supplementation | Bioavailable nutrient forms (methylfolate vs. folic acid, chelated minerals, vitamin D) | Vitamin D supplementation linked to up to 70% higher clinical pregnancy rates in fertility treatment |
| Both Partners Optimizing | Male factor contributes to ~50% of conception challenges | Couples optimizing simultaneously address the complete reproductive picture |
| Proactive Health Literacy | Access to research, testing, and quality supplements | Women with high stress levels are 29% less likely to conceive than those with low stress |
What These Controllable Factors Mean:
While you cannot change national TFR averages, childcare costs, or population-level trends, you directly control the nutritional and lifestyle environment where your eggs and sperm develop. The 90-day window means actions taken today influence conception attempts 3 months from now; this is measurable biological cause and effect.6
Since male factor contributes to approximately 50% of fertility challenges, couples optimizing simultaneously address the complete reproductive picture.13 One partner supplementing while the other does not leaves half the equation unaddressed.
Population trends toward delayed parenthood mean more couples conceive in their 30s and 40s when age-related fertility changes are more pronounced. Optimizing health 3-6 months before actively trying provides better outcomes than waiting until facing challenges.
The 90-Day Fertility Optimization Window
Your body continuously renews cells through predictable biological cycles. Eggs that will ovulate in coming months are developing now through a maturation process of approximately 90 days.6 Similarly, sperm production (spermatogenesis) requires 74-95 days from initial cell division to mature sperm. This creates a defined window where nutrition, lifestyle, and targeted supplementation directly influence the quality of eggs and sperm available for conception.
Realistic Timeline Expectations:
- Months 1-3: Active optimization period. Eggs and sperm maturing now benefit from improved nutrition, targeted supplementation, stress management, and lifestyle adjustments
- Months 3-6: Peak optimization window. Conception attempts during this period utilize highest-quality eggs and sperm influenced by your efforts
- Beyond 6 months: If conception has not occurred despite optimization and regular well-timed intercourse, medical evaluation is appropriate
Research shows preconception nutrition interventions improve outcomes, particularly when both partners optimize simultaneously.7
Evidence-Based Nutrition and Supplements for Preconception Health
Adopting a fertility-supportive eating pattern can measurably affect conception outcomes. Studies show Mediterranean diet patterns, rich in leafy greens, colorful vegetables, berries, fatty fish, nuts, seeds, olive oil, whole grains, and legumes, correlate with higher rates of successful conception both naturally and in assisted reproduction cycles.78
Key Nutrients for Preconception Health:
| Nutrient | Recommended Daily Amount | Role in Fertility |
|---|---|---|
| Methylfolate | 400-800 mcg | Supports healthy cell division and DNA synthesis. Up to 60-70% of people have MTHFR gene variants that impair synthetic folic acid conversion; methylfolate bypasses this genetic bottleneck |
| Vitamin D | 1,000-2,000 IU | Supports hormone regulation and immune function. Low vitamin D levels correlate with lower conception rates |
| Omega-3 DHA | 250-500 mg | Supports egg quality, reduces inflammation, and provides building blocks for fetal brain development |
| Zinc (chelated) | 15-30 mg | Supports egg maturation, ovulation, and sperm production. Chelated forms (bisglycinate) provide superior absorption |
| Myo-Inositol | 1,000-2,000 mg | Supports ovulation regularity and insulin sensitivity, particularly beneficial for women with PCOS |
Key Insights:
- Methylfolate (400-800 mcg) is particularly important: up to 60% of women have a genetic variation that reduces their ability to process synthetic folic acid, making bioavailable methylfolate the preferred choice.9
- Vitamin D supplementation has been linked to up to 70% higher clinical pregnancy rates in women undergoing fertility treatments. Low vitamin D levels correlate consistently with lower conception rates across multiple studies.1011
- For women with PCOS, myo-inositol at clinical doses (2,000-4,000mg daily) supports ovulation regularity and insulin sensitivity.12
What TFR Trends Mean for Personal Family Planning
Population-level TFR statistics measure collective behavior: when people choose to have children, how many they have, and whether economic conditions support family formation. These trends explain demographic shifts driven by delayed parenthood (average first birth age now 27.55), rising education levels (women earning 60% of advanced degrees15), and economic pressures (childcare costs up significantly over 30 years14), not biological fertility decline.
Action Steps:
- Start preconception support during the 90-day window with nutrient-dense foods, targeted supplementation, and stress management
- Involve your partner: male factor contributes to approximately 50% of conception challenges, making a coordinated approach more effective
- Focus on consistency: fertility optimization requires 3-6 months of sustained effort before biological changes manifest in egg and sperm quality
Preconception Health Support
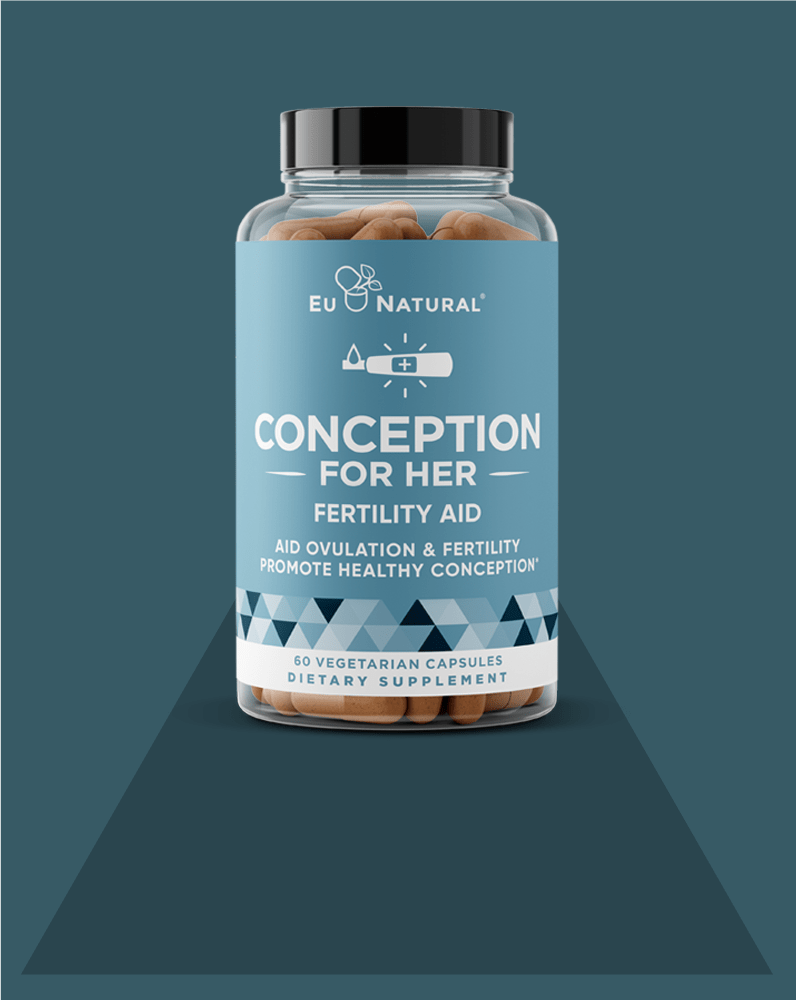
For individuals choosing to start families in their 30s and 40s, now representing the statistical majority of first-time parents, preconception health optimization supports reproductive readiness during life stages when biological fertility naturally changes. Eu Natural's Conception line provides evidence-based preconception support formulated by a scientific advisory board. The formulas include bioavailable methylfolate (not synthetic folic acid), chelated minerals for improved absorption, and targeted nutrients addressing both female and male fertility factors.
Learn About Conception for Her | Learn About Conception for Him
This report is provided for informational purposes and does not constitute professional or medical advice. Consult with a healthcare provider before starting any supplement regimen or making decisions about fertility, particularly if you have underlying health conditions or take medications.
Last updated: February 2026
Sources
1. Eu Natural Research Study, Eu Natural, New York, January 2026.
2. CDC National Vital Statistics Reports (2025). "Births: Final Data for 2023."
3. World Bank Open Data. "Fertility rate, total (births per woman)."
4. Pew Research Center (2025). "Parenting in America Today."
5. CDC National Vital Statistics Reports (2025). "Mean Age of Mothers is on the Rise: United States, 2000-2024."
6. American Society for Reproductive Medicine (2023). "Age and Fertility: A Guide for Patients."
7. Vujkovic, M., et al. (2010). "The preconception Mediterranean dietary pattern in couples undergoing IVF." Fertility and Sterility, 94(6), 2096-2101.
8. Karayiannis, D., et al. (2018). "Adherence to the Mediterranean diet and IVF success rate." Human Reproduction, 33(3), 494-502.
9. Greenberg, J. A., et al. (2011). "Folic acid supplementation and pregnancy." Reviews in Obstetrics and Gynecology, 4(2), 52-59.
10. Meng, X., Zhang, J., et al. (2023). "Influence of Vitamin D supplementation on reproductive outcomes." Reproductive Biology and Endocrinology, 21(1), 17.
11. Paffoni, A., et al. (2014). "Vitamin D deficiency and infertility: a systematic review." Journal of Clinical Endocrinology & Metabolism, 99(11), E2372-E2378.
12. Unfer, V., et al. (2017). "Myo-inositol effects in women with PCOS: a meta-analysis." Endocrine Connections, 6(8), 647-658.
13. Agarwal, A., et al. (2015). "A unique view on male infertility around the globe." Reproductive Biology and Endocrinology, 13(1), 37.
14. First Five Years Fund (2022). "Child Care Prices Rose Significantly in 2020."
15. National Center for Education Statistics (2024). "Degrees Conferred by Sex and Race."
16. Endocrine Society (2020). "Endocrine-Disrupting Chemicals (EDCs)."
17. U.S. Department of Agriculture (2017). "Expenditures on Children by Families, 2015." (Inflation-adjusted).
18. Lynch, C. D., et al. (2014). "Stress and fertility: a review." Current Opinion in Obstetrics and Gynecology, 26(3), 185-189.


